Automated 3D Reconstruction of Buildings
Overview
We developed a workflow for reconstructing urban buildings in Bonn from airborne laser scanning (ALS), mobile mapping system (MMS) data, imagery, and cadastral building footprints. Our workflow takes raw point clouds through preprocessing, semantic and instance segmentation, and Level of Detail 2 (LoD2) reconstruction, producing building models with explicit roof geometry.
These models support applications such as HD maps, urban visualization, and change detection. Detailed textured models, LoD3 reconstruction, and a fully automated pipeline remain future goals.
My contributions
My work focused on point-cloud preprocessing, LoD2 reconstruction using Roofer, hyperparameter optimization with Optuna, and evaluation against ground-truth models. These contributions formed the reconstruction and evaluation stages of our overall workflow.
From point clouds to building models
- Preprocess the data: align ALS and MMS in a common coordinate frame, crop to the mobile-mapping corridor, and remove noise, MMS ground points, and outliers.
- Add appearance information: colorize ALS using orthophotos and map fisheye-image colors to MMS points using image-specific extrinsics.
- Identify buildings: extract building-class points through semantic segmentation, then separate individual buildings. We explored cadastral footprints, hybrid footprint-supervised boundary models, and image-based instance segmentation.
- Reconstruct LoD2 geometry: apply the existing Roofer framework to point clouds and building footprints.
- Tune and evaluate: use Optuna to search reconstruction parameters and compare the resulting models with NRW LoD2 reference models.
Segmentation results
Our image-based instance segmentation approach, FaçadeSAM-Track, explores separating buildings without cadastral footprints. It combines image-based segmentation and tracking with LiDAR, assigning distinct instance colors to building façades in the point cloud.
The comparisons below show how the method assigns instance labels in two street scenes. Each predicted color represents a building instance.
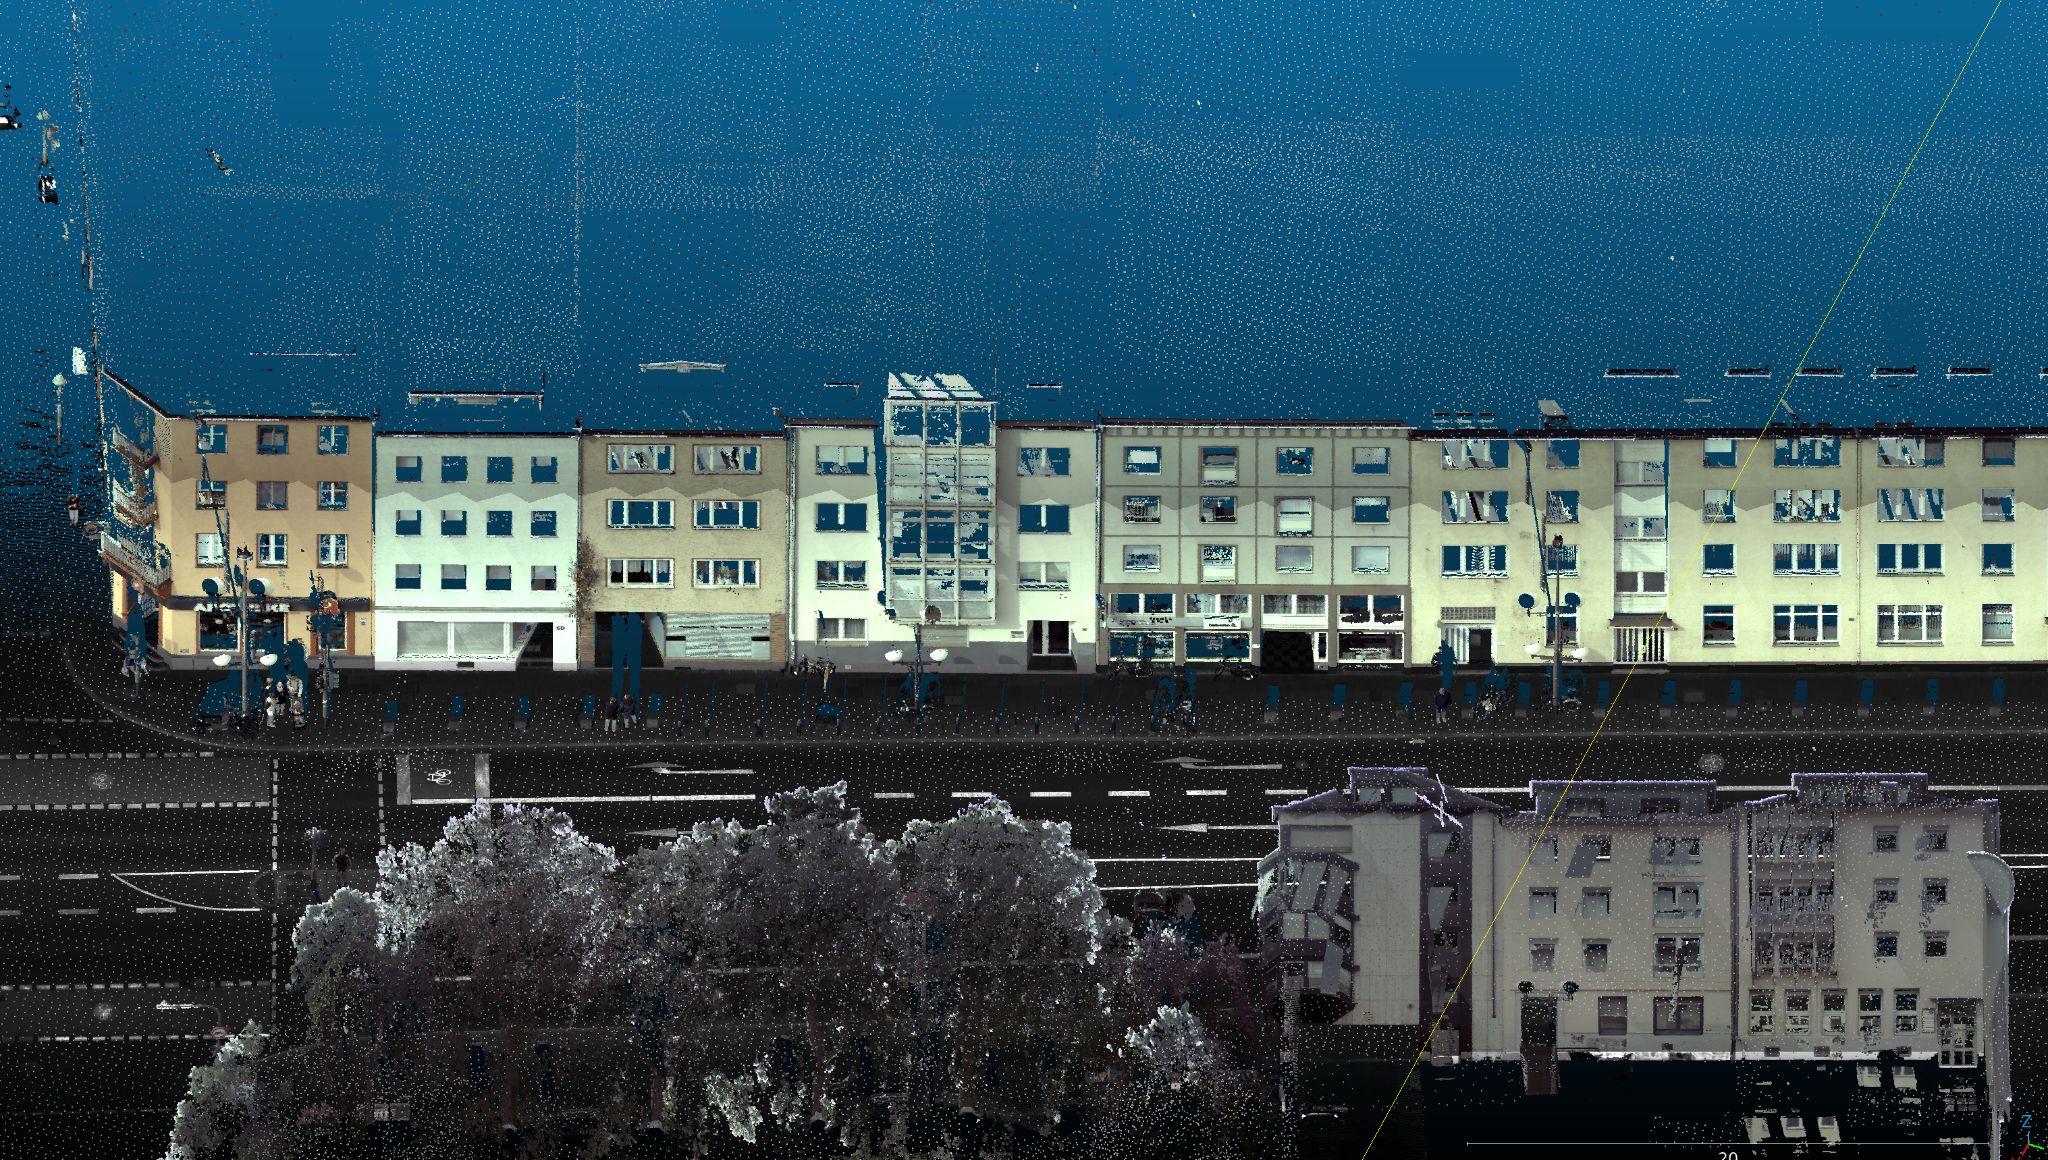
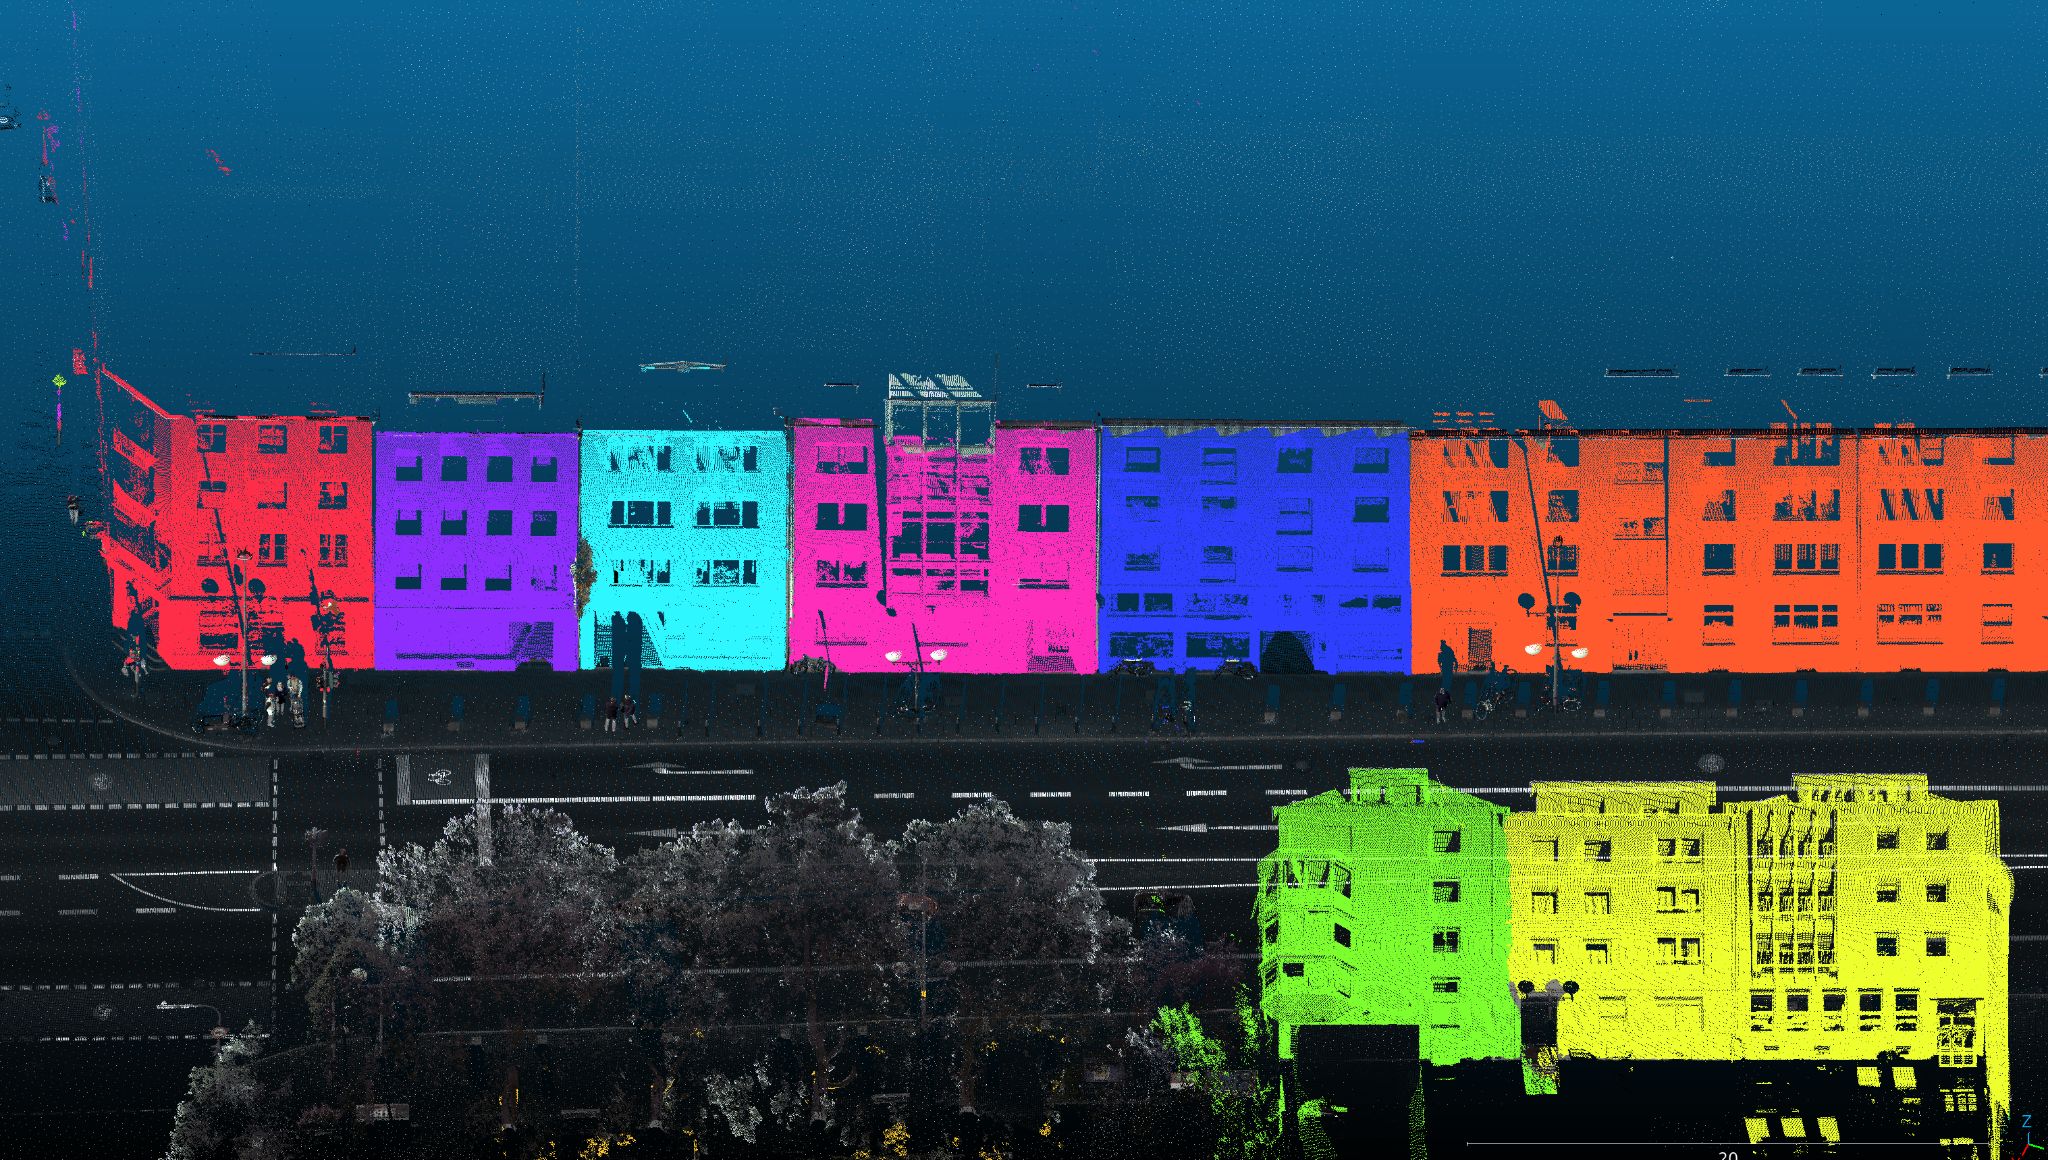
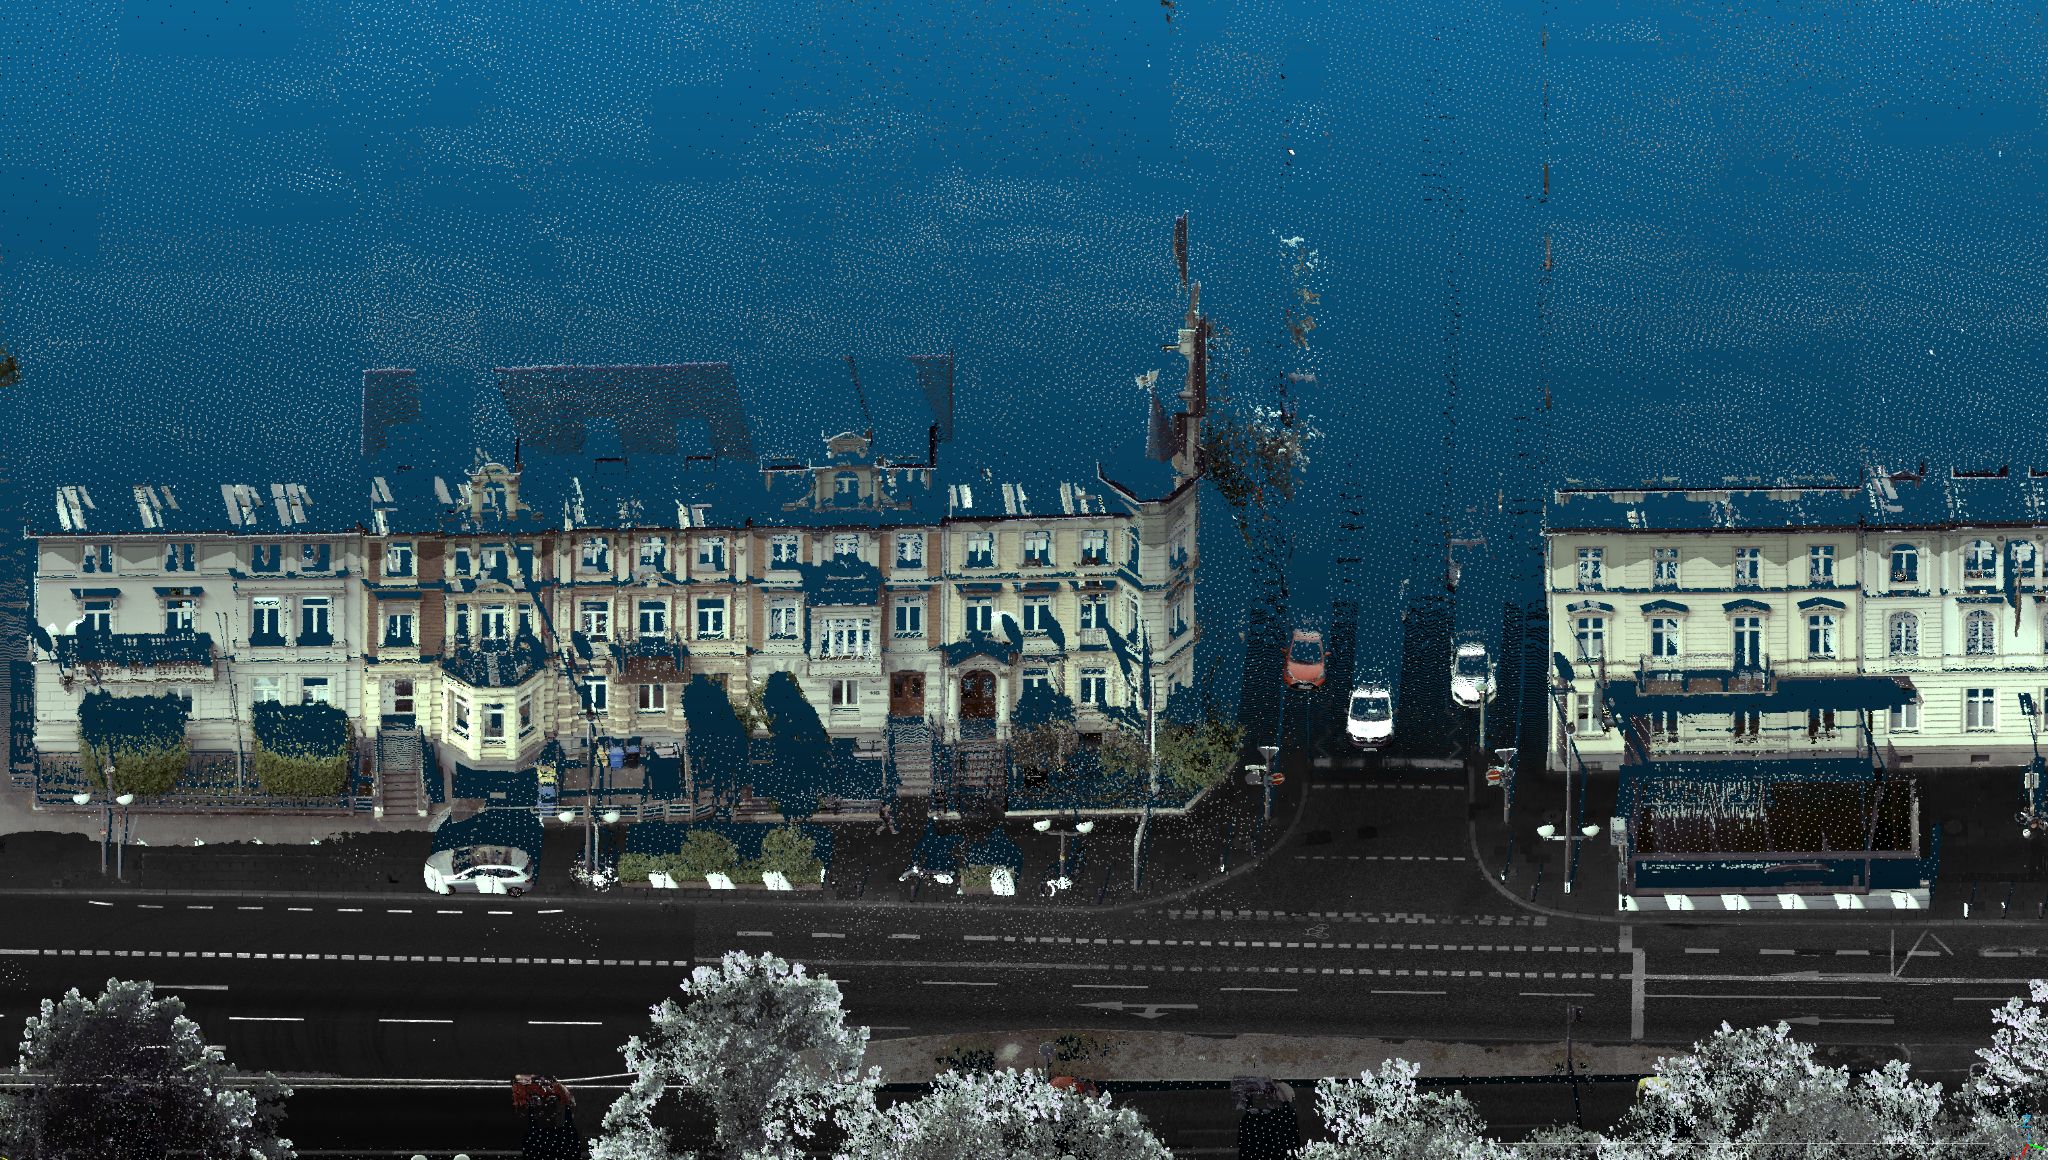
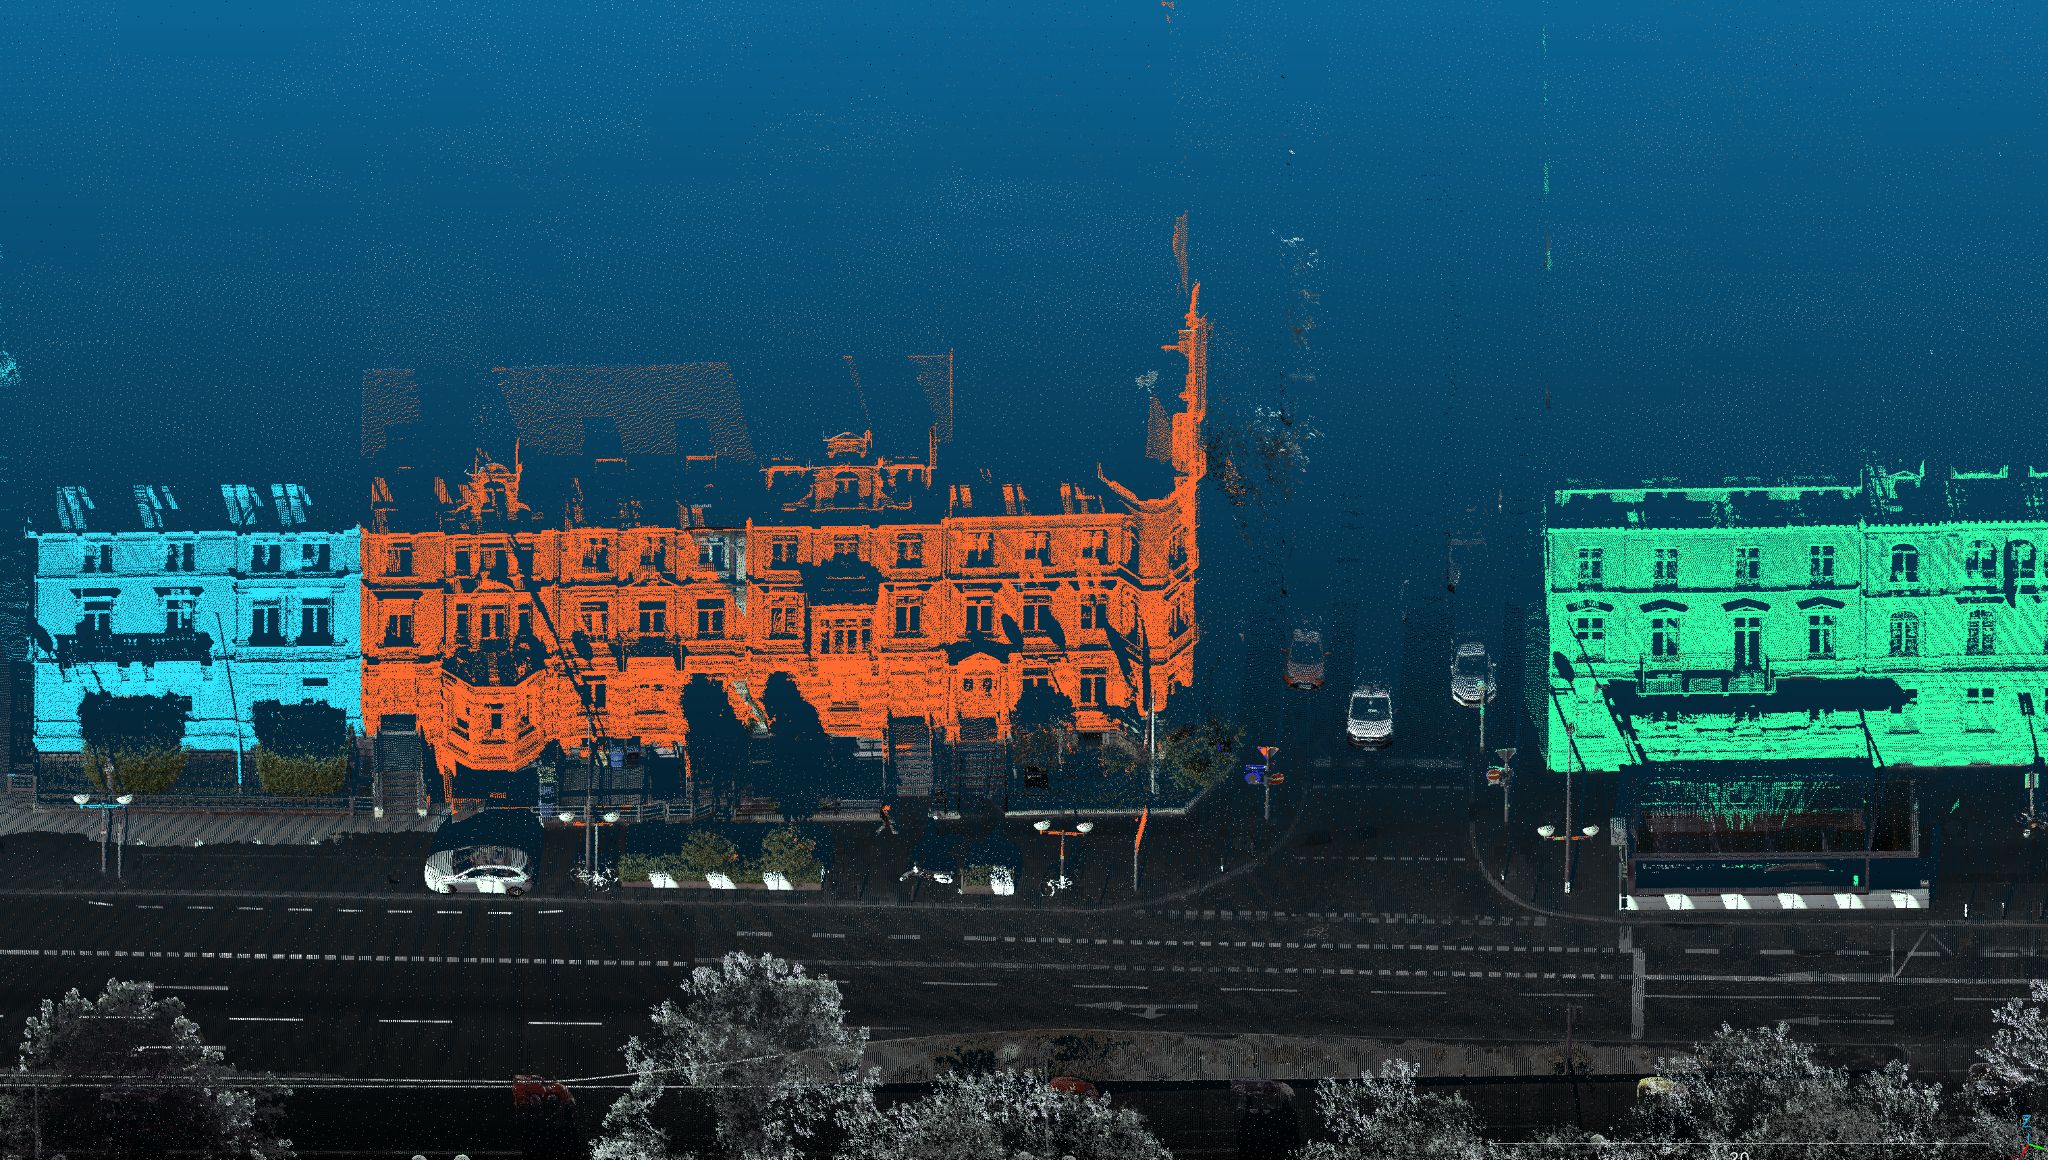
These examples illustrate our qualitative progress rather than a segmentation accuracy benchmark. We also observed failure cases; generalized instance segmentation remains an area for refinement.
Reconstruction and evaluation
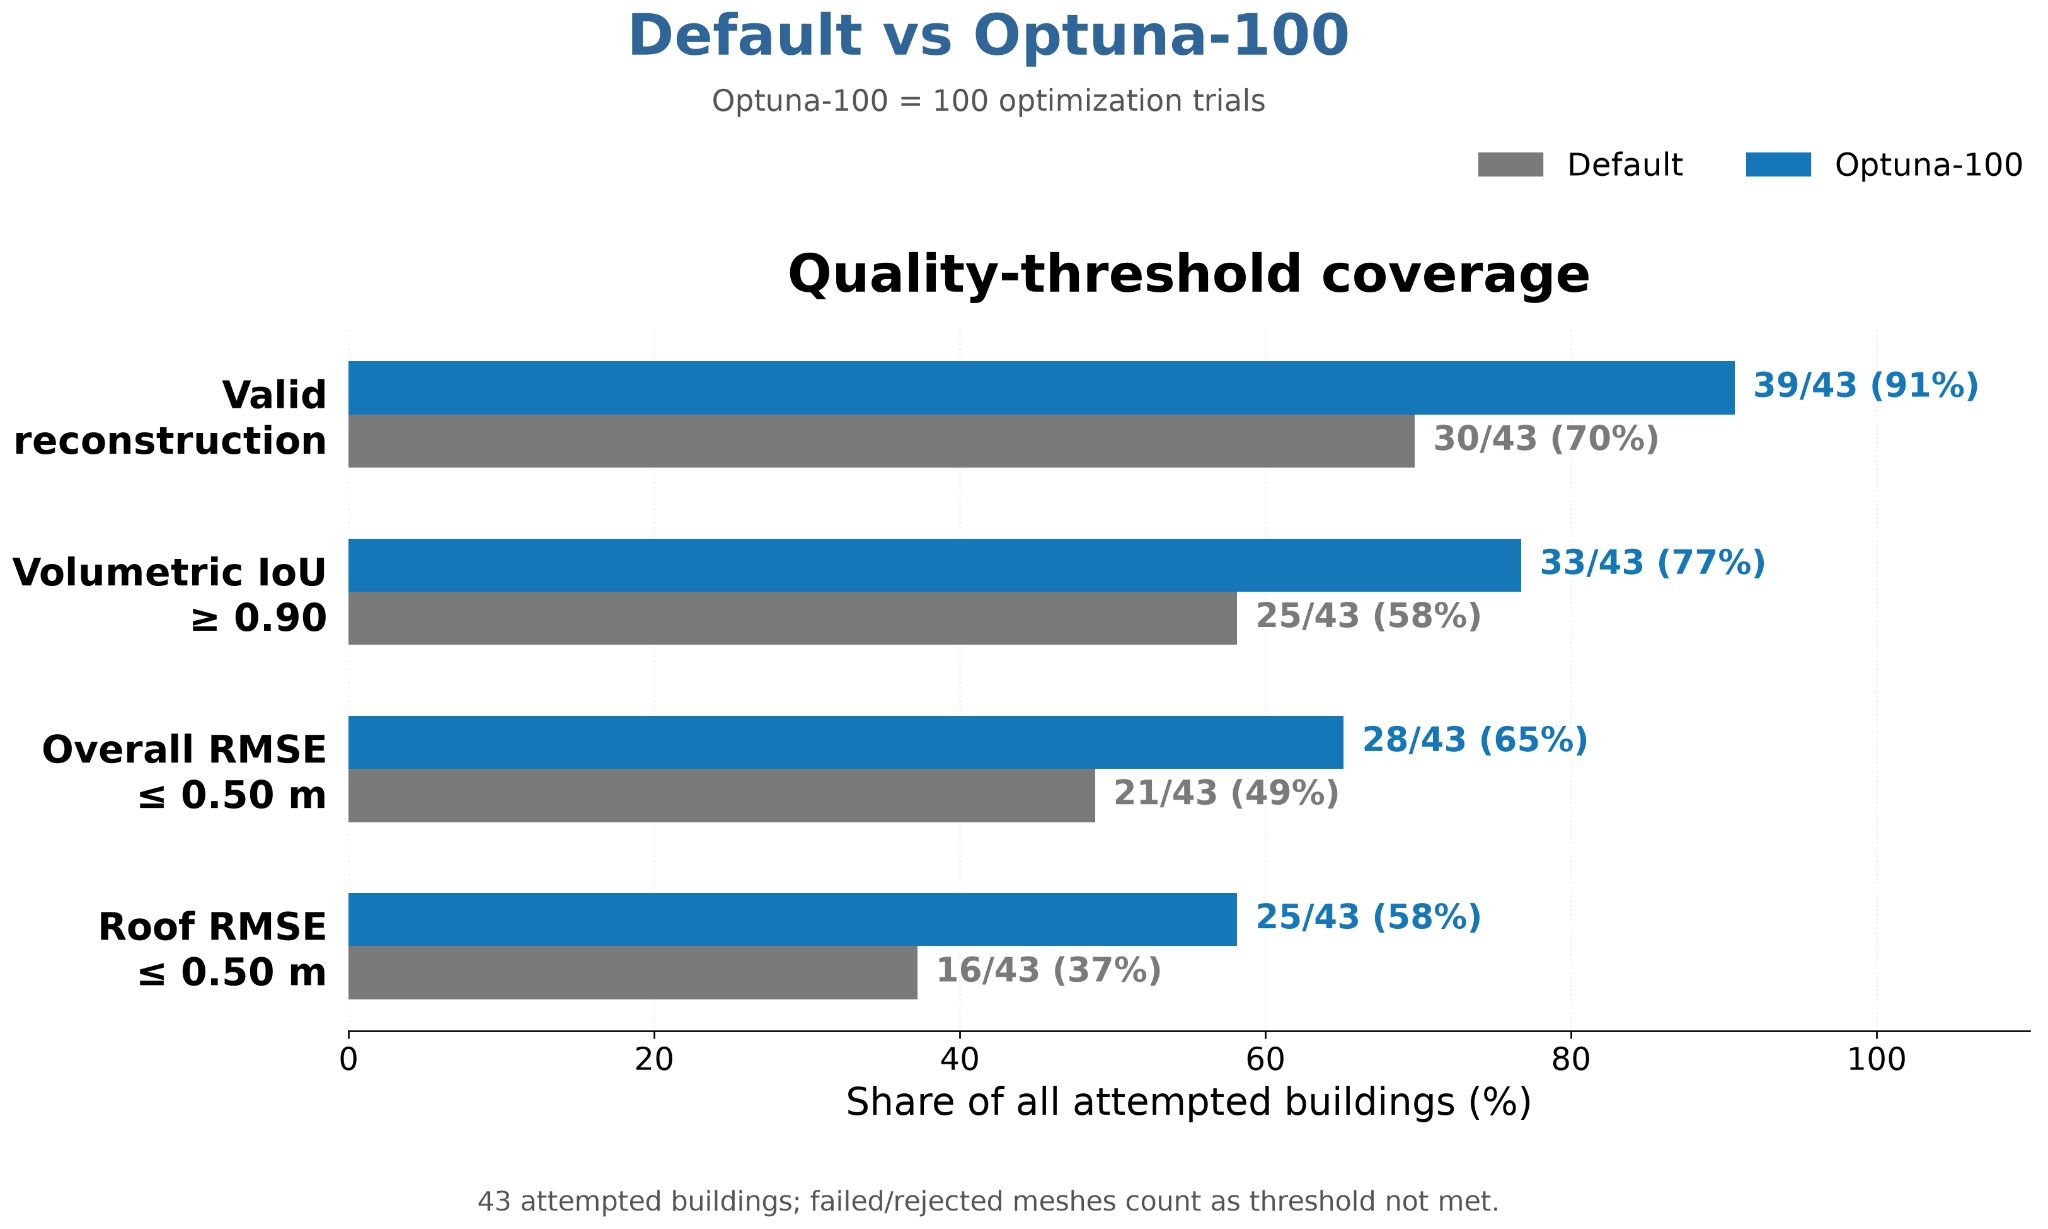
Default Roofer settings sometimes introduced unnecessary roof structures or failed to produce valid reconstructions. We compared these defaults with Optuna-100 (100 optimization trials) across 43 attempted buildings.
| Evaluation criterion | Default Roofer | Optuna-100 |
|---|---|---|
| Valid reconstruction | 30/43 (70%) | 39/43 (91%) |
| Volumetric IoU ≥ 0.90 | 25/43 (58%) | 33/43 (77%) |
| Overall RMSE ≤ 0.50 m | 21/43 (49%) | 28/43 (65%) |
| Roof RMSE ≤ 0.50 m | 16/43 (37%) | 25/43 (58%) |
Percentages use all 43 attempted buildings as the denominator, including invalid reconstructions. IoU measures volume overlap with the reference model; RMSE measures geometric error, where lower is better.
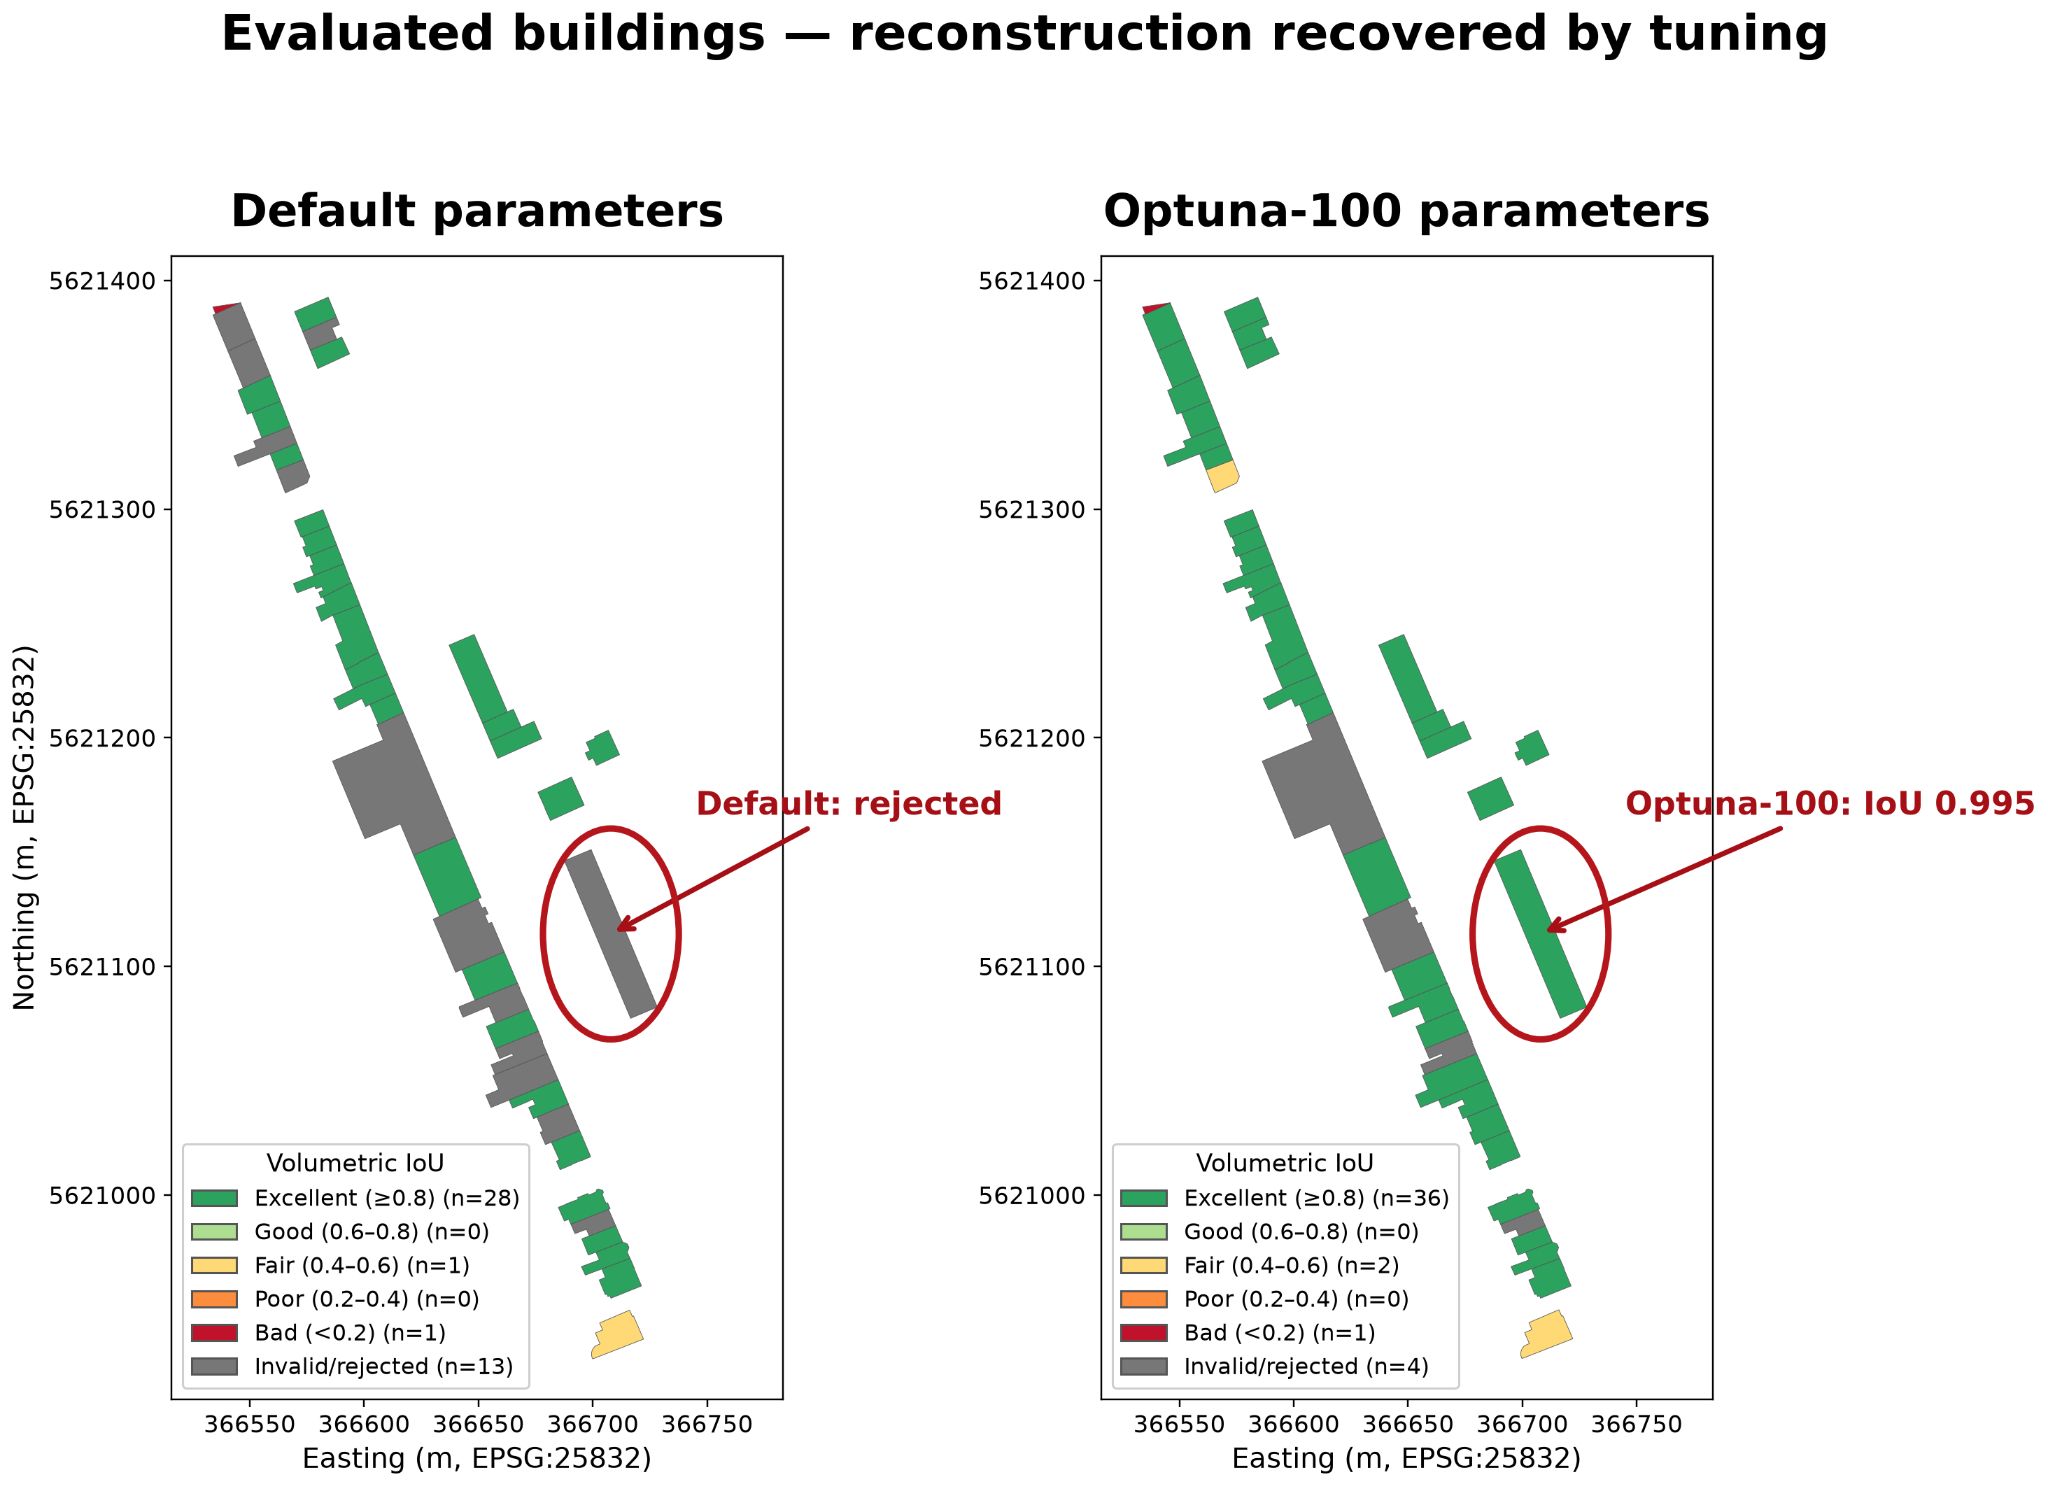
Tuning recovered nine additional valid reconstructions. In the spatial comparison below, one building rejected with default parameters achieved a volumetric IoU of 0.995 after tuning.
Geometry compared with reference models
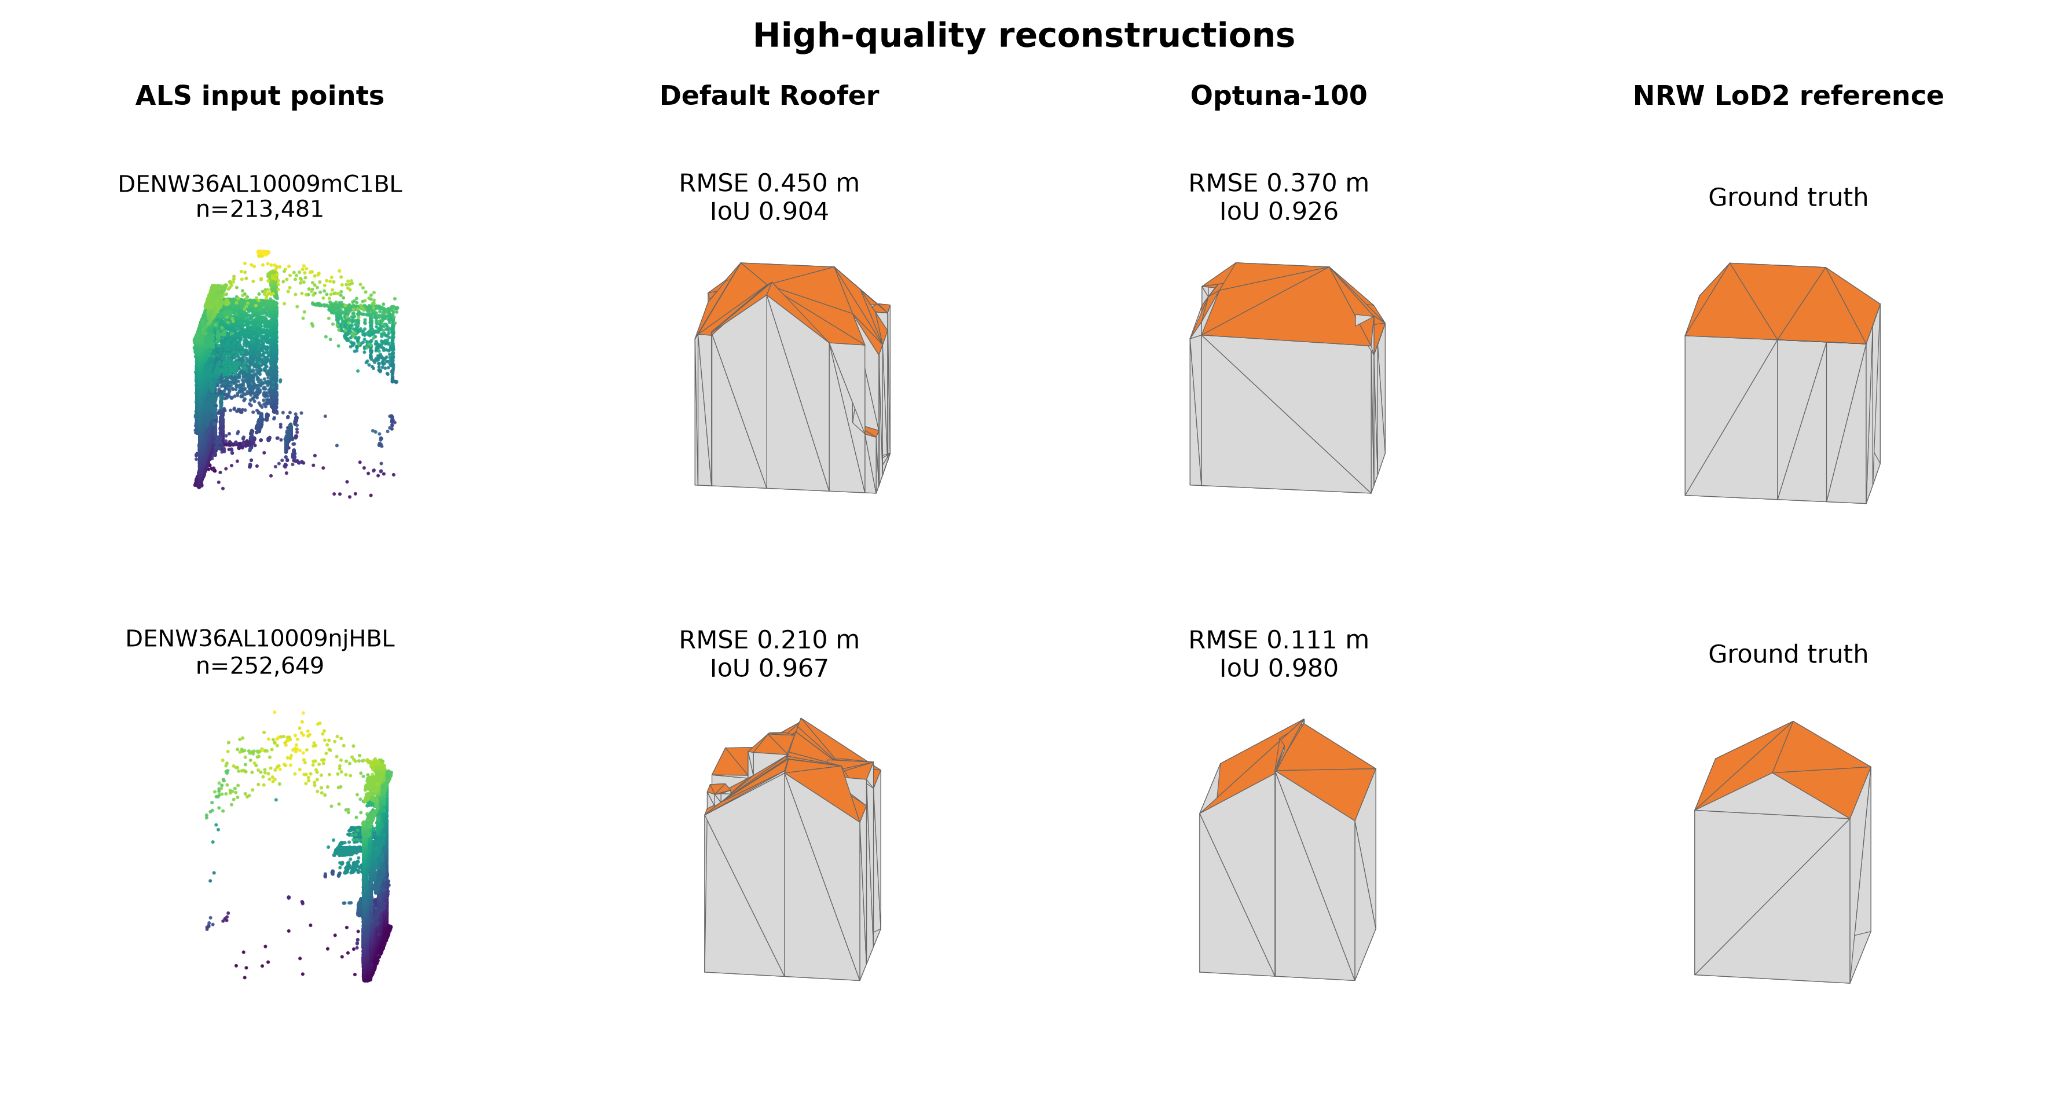
The examples below compare ALS input points, default Roofer outputs, optimized models, and NRW LoD2 references. For the two illustrated buildings, tuning reduced reported RMSE from 0.450 to 0.370 m and 0.210 to 0.111 m, while increasing IoU from 0.904 to 0.926 and 0.967 to 0.980, respectively. These are individual examples rather than dataset-wide averages.
Remaining challenges
Roof geometry remains the main limitation: only 25 of 43 buildings (58%) achieved roof RMSE ≤ 0.50 m after tuning. We also encountered unsuccessful reconstructions, sparse input data, and problematic reference geometry. Better reconstruction robustness therefore does not imply uniformly accurate roofs.
Building change analysis
We also compared cadastral building records associated with the 2021 ALS data and the latest 2025 cadastral data, reporting:
| Change category | Building count |
|---|---|
| Unchanged | 1,241 |
| New | 14 |
| Modified | 10 |
| Demolished | 14 |
| Rekeyed / restructured | 3 |
Next steps
We plan to refine LoD2 roof geometry, improve generalized instance segmentation, extend reconstruction to LoD3, automate the full workflow, and create VR building models.
Team and credits
Team: Shiva Rudra Lolla, Ravikumar Chaurasia, Poorna Sasank Sesetti, Pranesh Gopal, and Carine Allen.

Shiva Rudra Lolla
Robotics Researcher
My research interests include autonomous systems and perception. Drop me a message if you want to connect!